Making a distributed phenomenon visible
Air quality changes across space and time, and a single monitoring station cannot describe every local context. SenseSquare studies a distributed monitoring network designed to collect environmental readings and turn them into information available to organisations and citizens.
From sensor to data
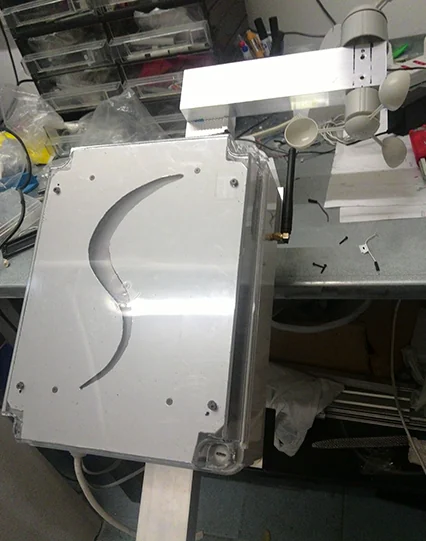
The proposed stations measure PM2.5 and PM10 alongside temperature, humidity, pressure and wind direction; an extended configuration also includes ozone and carbon monoxide. Nodes acquire readings and transmit them through wireless or mobile connectivity. The technical architecture further examines LoRaWAN and edge concentrators for data aggregation. Stations are conceived for distributed installation on buildings and other territorial points, where placement and environmental conditions affect measurement quality.
The backend and database store parameters received from the network. A multitenant approach supports different instances and profiles, while web and mobile dashboards present maps, charts and tables. GIS integration places measurements in their geographic context and enables trends to be compared.
Designing operational continuity
A sensor network needs more than hardware: installation, power, coverage, maintenance, component replacement and data quality must be part of the service model. The project therefore connects prototype, suppliers, connectivity, platform and end users.
Project360’s contribution
Project360 supported the funding application, business plan and business case, technical-economic analysis and software and application design. The work connected technology feasibility, operating model and the public-funding path while keeping specialist hardware responsibilities distinct.
Transferable value
The case shows how distributed measurements become an information service. Designing sensors, network, data model and interfaces together makes the solution adaptable to different territories, buildings or plants and turns raw readings into decision support. This system view supports phased deployment: a prototype can validate acquisition and transmission before the platform extends to additional stations, profiles and geographic contexts with controlled operational learning across successive deployment phases.
Funding and project development
Terna’s Next Energy programme awarded the project a €20,000 cash grant. This support connects sensor experimentation and environmental data collection with the definition of a service for organisations and local communities.